Introduction
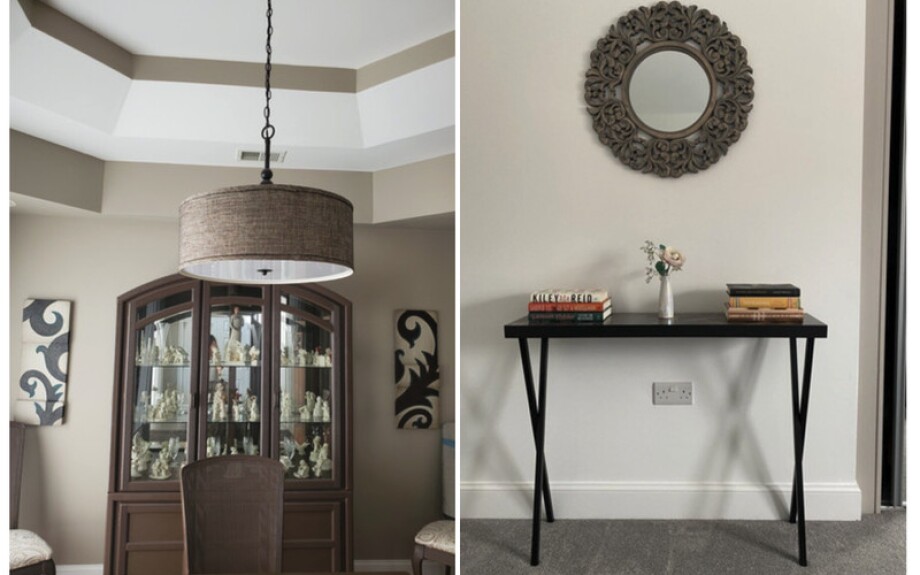
In 2020 our colleagues worked on a new version of a Product Detail Page (PDP). This is the page that our customers see when viewing a product. The new design gave more prominence to customer photos from product reviews in a form of an UGC (User Generated Content) image carousel. You can see an example of how it looked like below.

You probably noticed that quite a few of the customer photos do not look inspiring or informative for the potential buyers. They have odd angles, framing of the objects in the photo are far from perfect, poor colors and lighting, etc. At Wayfair we care deeply about customer satisfaction and experience and want to help our customers see good looking photos that can help make an informed decision. We will further refer to such images as good quality images.
At Wayfair, we sell products online where our customers cannot try or see products in person. As a result, our customers rely significantly on product images when weighing their purchase. In previous work we confirmed that conversion rate (CVR) is highly responsive to the quality and relevance of product information. Working on the belief that consumers weigh product images heavily in purchase decisions, we decided to explore opportunities to sort images based on image quality.
However, images from our suppliers may not be enough. First of all, there may be too few supplier images to get enough information about the product. Moreover, supplier images may not be diverse enough e.g. shot from a specific angle on a white background. In this case customers cannot see how the product may look like in a real life environment e.g. a coffee table in a living room. Therefore, we saw great potential in User Generated Content in inspiring and informing our customers.
How can the DS Team help
We decided to create a solution that can order images in the UGC photo carousel so images with the highest quality are shown first. This change saves time and provides better information for our customers. Our first attempt was to look at technical aspects of photos such as brightness and contrast. However, our experiments demonstrated that such aspects were not enough to create a reliable solution. So we started looking at existing Computer Vision models for image quality assessment.
After doing research on the existing models we decided to use the
NIMA (Neural Image Assessment) model. An open source implementation of NIMA was released by
Idealo and contains two models, one for evaluating technical aspects of images and another for the aesthetic side of images. We also added an existing model (STL-D) from another team which was a binary classifier based on
Inception-V3 and fine-tuned on images with damaged Wayfair products and social media photos of Wayfair products. It is worth noting that NIMA outputs predictions on a score ranging from 1-10 while STL-D on the range from 0 to 1. However, our evaluation metric was based on ranking images by their quality score which made the comparison between models straightforward.
Thinking about Dataset
The next step was to create a dataset on which we could evaluate the selected models. Creating such a dataset may be challenging because image quality is rather subjective. For example, one person prefers yellow over blue and may like a photo of a yellow couch better. Another person may like bright photos over normal lighting. So it was necessary to have multiple annotators for each image to reduce the bias. In our case we used five annotators for each example.
Another important question was the way of assessing the image. The first thing that may come to mind is to show an image and ask an annotator to rate it on the scale of 1 to 10. However, after reviewing the literature on the topic we discovered an issue with such an approach. First of all, it is challenging to assign a score to an image without seeing enough points of reference and getting to know the domain better. Due to the challenging nature of the task it may take a considerable amount of time. Second, annotator scores start shifting to the median value of the scale rather quickly and you may end up with a significant part of the dataset rated around 5 or 6 out of 10. In other words, after a while most images start looking somewhat OK to the annotator. So we decided it was better to have a scenario where an annotator is shown two images side by side (pairwise comparison) and asked to select the most helpful in informing a purchasing decision. This approach reduces the mental strain on the annotator and greatly simplifies the process.
In our pairwise comparison approach each image is shown the same number of times in different pairs for a product. For n images we take C (n,r) pairs where r is the number of images in pair (r = 2). The number of possible combinations C(n, r) for annotating 4 images is a reasonable option which only requires 6 comparisons. It is clear that when labeling images from thousands of products it may get expensive quickly if you use a high number of images per product.

Once you have each image appear in comparisons 3 times you can calculate its score. For each comparison where the image was selected it gets one point. So the lowest number of points is 0 while the highest is 3. If we normalize the number of points on the scale from 0 to 1 the possible image scores in the dataset will be 0.0, 0.333, 0.666 and 1.0.
Dataset Creation
We started building the dataset by randomly sampling 6250 products from all product classes with a stratified strategy. Considering 4 images per product that gave us 25k images and 37.5k image pairs. We also randomly replaced 1 image with a lead supplier image in 10% of classes. Lead supplier image is the main image shown on the product page. Lead supplier images typically have highest quality and can give us an idea about the consistency of annotators’ ratings. These images can also be used to calibrate annotators’ scores if the need arises. After evaluating the annotator score distribution we saw supplier scores having significantly higher scores from annotators which is shown in the histogram below.

Metrics
When we thought about how we can evaluate models performance we wanted metrics to be close to the business goal which is ordering images by their quality. So the task was to compare two image rankings: one is from a model and the other is from annotators’ scores. For the comparison we used
Kendall’s tau correlation and more specifically tau-b version because it accounts for ties in ranks.
Model Evaluation
We evaluated three selected models (NIMA technical, NIMA aesthetic and STL-D) on the collected dataset. All 3 pre-trained models demonstrated rather poor performance on our task. NIMA aesthetic had a significantly higher correlation score with human annotators compared to NIMA technical, which indicates that using only technical aspects of photos may not be enough to determine whether the photo is good. Another observation was higher performance of STL-D compared to NIMA models. This may be attributed to the fact that STL-D was trained on the images of Wayfair products so the model was more familiar with the domain compared to competitors trained on the dataset with general imagery. This observation indicated an opportunity to increase the correlation score if we fine-tune a pre-trained model on our dataset.

Model Fine-Tuning
The project had very tight time constraints because there was a short window in the schedule of A/B tests where we could evaluate the impact of our ML model. So we decided to use tried and true Inception-V3 architecture as a backbone for our model with a regression function in the output. We ran a set of experiments on the model and experimented with data augmentation, learning rate annealing and dropout layer. Additionally, we ended up fine-tuning all layers of the pre-trained Inception-V3. We named the new model VoC-v1 (Voice of a Customer v1).
The network was pre-trained on ImageNet classification task and standard approach of removing the head of the network and fine-tuning the layer before the head was not producing good enough results. This may be explained by the different nature of the tasks where the network needs a different set of features to provide the necessary performance. Therefore, training only one layer of the network may not be enough and fine-tuning more layers should help the network to discover new patterns necessary for working on a new task.

Additionally, we fine-tuned two pre-trained models that we already had: NIMA aesthetic and STLD. While NIMA aesthetic and STLD had very close scores (0.247 and 0.241 respectively) our custom model VoC-v1 demonstrated a significantly higher correlation score of 0.474, so we used it in the end.

Impact
The model demonstrated a high impact both on the image order for our products and on the business metrics. First, we scored all our UGC images for all the products at Wayfair. Before using our model the images in the UGC carousel were shown sorted by the date of submission. We found that for 85% of products the order of images in the carousel will change if we use image ordering based on the scores of our model.
After running A/B tests for a few months we saw significant improvements in business metrics. Session level conversion rate (CVR) for all users increased by 0.35% while Add to Cart rate (ATCR) by 0.21%. For desktop users CVR increased by 0.51%. Moreover, 7-day order rate increased by 0.33%. Considering the scale of our business these improvements have a significant impact on the business.