Why conduct geo experiments?
At Wayfair, A/B experiments are considered the gold standard to measure the impact of initiatives across the company, including marketing efforts and customer and supplier offerings. Usually A/B experiments are conducted at the individual user level, where eligible users are randomly assigned into control and treatment groups. However, user-level A/B experiments are not always feasible (e.g., when user-level targeting is not possible) or may be invalid (e.g., the treatment assignment of one customer impacts the outcomes of other customers).
Geo-experiments, a method in which ‘geo’ areas are divided into comparable groups, can be used as an alternative way to measure incrementality. This method assigns certain geo regions into the control and others into the treatment based on historical metrics, and measures the impact between geo regions. This enabled Marketing teams to more accurately measure the incrementality of non-digital marketing channels (e.g., direct mail, billboards) and channels run on other vendor platforms (e.g., Google product listing ads). For more background on geo-testing and details on geo-testing methods we used previously, check out our previous blog post. In this blog post, we dive into how we have evolved our design and measurement of geo experiments and created a stronger validation framework to continually improve our methods.
How do geo experiments work?
There are 3 main steps to perform a geo test: 1) define the geo test units; 2) design the experiment by assigning geo units to treatment groups; and 3) measure the treatment effect or “lift."
Define geo test units
In contrast to traditional A/B experiments where it is natural to split on the user/customer level, geo units (“geos”) can be defined at a range of granularities (Figure 1 contrasts customer splitting units against geographic splitting units). In Wayfair data, the most granular geographic unit in the US is ZIP code (each visit to Wayfair can be associated with a ZIP code inferred from IP address). However, assigning treatment at the ZIP code level is problematic because ZIP codes are typically small and people travel across ZIP code boundaries often, which we see in our data. This produces a high rate of cross-pollination, whereby users are exposed to multiple treatment conditions, invalidating the experiment. To reduce cross-pollination, in US experiments we use 210 geos, which are mutually exclusive clusters of ZIP codes (Figure 2 shows a map of US geos). In non-US experiments, we create geos similarly - as clusters of contiguous postal codes whose size optimizes the tradeoff between customer cross-pollination and experimental sensitivity.

Geo experiment design
In any AB test, we want to assign units to two or more balanced groups. Randomization will achieve this for user-level tests with millions of users. However, randomization produces high between-group variance for geo experiments since we only have 210 geos and their market size distribution is highly skewed. For example, the largest geo, New York City, accounts for 6.5% of Wayfair US market share, and the smallest one accounts for 0.013%. In addition, we often cannot run holdout tests with a 50% holdout because of the large opportunity cost. For example, we cannot tolerate holding out 50% of the whole US from seeing ads because that would lead to millions of dollars of lost revenue each day of the experiment period. Therefore, our goal is to hold out a subset of geos that precisely match the treated geos (on some set of pre-treatment covariates) and whose aggregate market share is tolerably small.

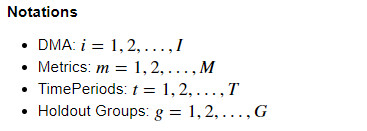
To overcome the challenge of the small number of geos, we use optimization to assign geos to treatment groups. Initially, we formulated the geo design question as a relaxed convex optimization problem, inspired by synthetic control methods (see our previous blog post). Since then, we have re-formulated the task as an integer optimization problem, which enables us to include all geos in experiments, rather than just a subset, while precisely balancing groups on multiple KPIs. Suppose there are many available geo units, and each geo unit has historical time-series data over multiple metrics like site visits, orders, revenue, etc. The goal is to create one (or more than one) group of geos whose aggregate market share on the selected metrics is as close as to the specified holdout percentage (e.g., 15%) as possible. Each geo unit i is given a binary decision variable Xig indicating whether unit i is assigned to group g. The goal is to minimize the difference Ztm,g, g between the aggregate share of the selected geo units and the specified share (e.g., 15%) on metric m at time t. This method ensures that the holdout geo units match the treatment geos across multiple metrics.


This formulation is flexible enough to cater to different requirements. For example, if we want to include (or exclude) a specific geo unit in a group, we can pre-assign Xig to 1 (or 0). In addition, if we want to restrict the number of geos in a group, we can add an additional constraint ΣiXig≤boundu.
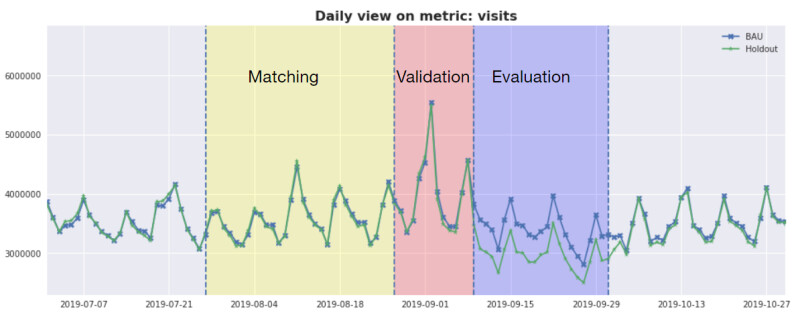
In a real world experiment, we reserve a buffer period between the matching window and launching the geo experiment (Figure 3). This window enables us to observe the stability of the test design and is used by the estimator to learn the variance in the post-matching period.

Geo experiment measurement
After the experiment has been shut down, we are ready to measure the impact of the treatment. The most granular data available are metric per geo unit per day, but we aggregate them to treatment group-level daily time series for measurement. This creates two time series spanning the pre-test (matching + validation) and test (evaluation) windows.
At Wayfair, we currently use Google’s
time-based regression model for estimating lift in geo tests. This method learns a linear relationship between the control and treatment group time series during a pre-test period, and then predicts the treatment group counterfactual time series during the test period. Bayesian inference is used to compute posterior prediction intervals at each time step, from which credible intervals on the lift estimates are calculated. For typical Wayfair revenue time series, we have found that it’s critical to limit the length of the time series we use for training the model and the length of the test in order to avoid overly-precise estimates, which result in elevated false positive rates.
How do we know our approach is performing well?
We evaluated the performance of our geo testing methods on typical Wayfair data. When selecting methods, we generally give greater weight to empirical performance on Wayfair data than theoretical properties. Procedure:
- Resample real data
- Assign units to treatment by simple randomization or integer optimization
- Apply constant multipliers to the treatment group to simulate AB tests, or no multiplier for AA tests
- Estimate lift in the simulated experiments (we compared the time-based regression model against a diff-in-diff model with time-based bootstrapped standard errors)
- Compute evaluation metrics like MSE, variance, bias, and coverage
Results show that the most important parameter to control is the test length. Longer tests rapidly increase the rate at which we falsely find effects (Type I error). In addition, time-based regression model variance is sensitive to the length of the pre-test time series. This enables us to use the amount of pre-test data as a tuning parameter to obtain correct model coverage based on historical data.
In terms of bias, integer optimization is theoretically susceptible to producing biased estimates, since treatment assignment is deterministic based on unit size, rather than random (it’s “quasi-experimental”). However, when varying the time frame of simulation datasets, the bias converged toward zero and was not distinguishable in size from the bias of randomized designs. We conclude that the improved coverage under integer optimization for the geo experiment duration we typically run at Wayfair is worth the potential for a small increase in bias.
We are always improving our methods
Geo testing is the least sensitive of the experiment types we typically run, which reduces its utility for smaller marketing channels or interventions with small expected effects. Thus, we continue to explore ways to increase geo test sensitivity while retaining valid inference. Some explorations include state-space regression models, introducing random elements into assignment and applying randomization (permutation) tests, and retaining geo level parameters in the estimator, rather than collapsing data to treatment group-level time series.
Two other challenges with geo testing at Wayfair are natural shocks and geo testing outside the US. geo tests are susceptible to geo level or regional shocks, triggered by natural events like hurricanes, which have forced us to cut multiple geo tests short. Implementing geo tests in other Wayfair markets, like Canada, Germany, and the UK, has also proven challenging because the populations are more highly concentrated in smaller geographic areas, which makes it challenging to divide those countries into geos whose boundaries are not frequently crossed. Defining larger geos reduces cross-pollination rates, but reduces the size of the sample space for creating balanced treatment and control groups.
