In the last decade, Wayfair relied heavily on its homegrown ticketing system for its Engineering, Product, and Operational needs. Starting Q1 2020, Wayfair decided to standardize on Projecthub (Atlassian Jira) thus enabling a range of powerful features, all unified under one single platform. Containerized Jira environment is a relatively fresh practice in the industry and we had to break new ground in customizing Jira’s Docker image to fit our needs. Another learning exercise was the deployment of this third-party application as a Stateful set on our on-prem k8s cluster.
The Projecthub platform has enabled the following functionalities -
- Scrums and Kanban boards
- Service Desk queues
- Email to issue creation
- Program management, Roadmap, Gantt chart
- Dynamic and customizable intake forms
- Self-serviceable Automation rules and Scripting
- API and Integrations (Slack, Github, Google, other internal / 3rd party tools etc)
- Out of the box Reporting / Custom Reporting
- ITSM and CMDB capabilities
- Custom plugin development SDK
- And many more
System Considerations
In this article, we will explore the technical design choices that went into the Jira setup and its rollout. The key considerations that went into system setup:
- High Availability - A strategy to provide a specific level of availability, in Jira's case, access to the application. Automated correction and failover are part of high availability planning.
- Performance - Highly performant pages and endpoints with acceptable response times.
- Scalability - Ability to scale instantly without repetitive and costly admin tasks. Enable tens of thousands of users and millions of issues.
- Monitoring - Ability to view, query, and set up alerts on system logs for monitoring and debugging purposes.
After evaluating the needs of the Jira system and reviewing Wayfair's specific requirements in terms of load, usage, and desired features, running Jira on containers hosted on Wayfair’s on-prem Kubernetes cluster emerged as the most optimal solution. Kubernetes is an open-source platform that orchestrates container runtime systems across a cluster of networked hardware resources. This strategy has given us fine-tuned control and autonomy over the Projecthub platform, along with a range of other benefits that come with the infra-as-code paradigm.

We run the Jira DC (data center) version for the Projecthub platform. Here are the specs
- Deployed on-prem BO1 DC → bo1c2 k8s cluster
- Jira Data Center version (current version 8.11.0)
- 6 Jira Server instances / 6 k8s pods on 6 k8s nodes
- 100Gi ram
- 10000m CPU
- MS SQL backend + NFS Storage share (for the filesystem, attachments, plugin data)
- Projecthub docker image
- Atlassian Jira docker image - https://hub.docker.com/r/atlassian/jira-software
- Additionally, we have a dev and stage environment
Benefits of running Jira on containers and k8s
Using k8s model comes with the following benefits -
Container environment
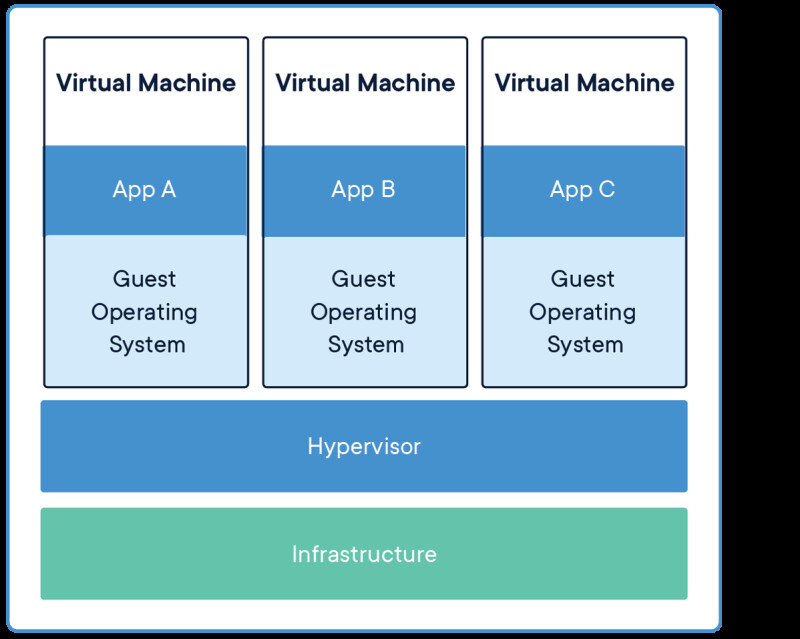
Docker container image is a lightweight, standalone, executable package of software that includes everything needed to run an application: code, runtime, system tools, system libraries, and settings. Instead of virtualizing the hardware stack as with the VMs approach, Containers virtualize at the operating system level, with multiple containers running atop the OS kernel directly. This means that Containers are far more lightweight: they share the OS kernel, start much faster, and use a fraction of the memory compared to booting an entire OS.

| 
|
Atlassian Jira’s official docker image runs on Linux-based (container os) openjdk8 base image. For Projecthub, we created a custom Wayfair specific docker image that extends from the official Atlassian docker image.
High Availability
Jira DC version achieves high availability via active clustering and automatic failover. With active clustering, every Projecthub pod is essentially an active Jira instance, which is able to serve requests. If a pod fails/dies, the load balancer will automatically fail sessions over to a remaining active pods. Most users will not notice any downtime, as they will be automatically directed from the failed pod to an active pod on their next request.
Auto Recovery
One of the main benefits of k8s is high resilience and self-healing. A pod has a restartPolicy field with possible values Always, OnFailure, and Never. The default value is Always. If any of our Jira installations on a given pod dies, k8s spins up another “Jira pod” as a replacement without manual intervention.
So the minimum number of Jira replicas/pods in our production cluster always remains constant and there is no downtime or performance degradation even during outages.

Declarative Configuration (infra as code)
Everything in k8s is a declarative configuration object that represents the desired state of the system (vs series of instructions in the traditional approach). As an example, consider the task of running 3 replicas of Jira DC instances. With imperative configuration and traditional VMs, it would be, “run A, run B, run C” whereas, with declarative configuration, it is simply “replicas = 3”. User errors can be prevented since everything is scripted out.
Scalability
With k8s, we can scale instantly without repetitive admin tasks. Through our Helm charts, Jira application and environments exist as code, so they are immediately reproducible through automation. Scaling can be achieved manually through one-line change code deploys or automatically via HPA and metrics such as resource utilization, no. of request, etc. Theoretically, we could also achieve manual scaling through simple kubectl commands - kubectl scale statefulset projecthub --replicas=8
Zero downtime deploys and upgrades
Jira is a stateful application. For Projecthub we use a StatefulSet with a RollingUpdate strategy, which is an automated update strategy. This guarantees ordered creation of Jira pods.
- For a StatefulSet with N replicas, when Pods are being deployed, they are created sequentially, in order from {0..N-1}.
- When Pods are being deleted, they are terminated in reverse order, from {N-1..0}.
Since k8s are based on immutable infrastructure, for Jira deployments and upgrades we simply build a new container image with a new tag and deploy it. Pods are deleted and recreated (with the new version) one at a time in reverse ordinal order. So at any point in time, only one pod is down while the rest of them can still serve requests. This enables zero downtime for our deploys & upgrades.
Jira Configuration
Atlassian’s official docker image provides a comprehensive set of box environment variables that we can leverage. By setting these env vars in our Helm chart we can automatically configure our Jira application. Most aspects of the deployment can be configured in this manner. For example, DB connection strings such as db type, db driver selection, db jdbc url, username, password, max connection pool size, JVM min/max memory, etc are all env variables.
Health checks
Kubernetes provides key mechanisms that allow us to monitor our Jira containers’ health and restart them in case of failures: probes and the restart policy. Probes (liveness and readiness) are executable actions, which check if the specified conditions are met. The pod’s restart policy specifies actions for failed containers.
Projecthub’s readiness probes ensure that the container is ready to start accepting traffic. A Pod is considered ready when its Jira DC container is ready.
Projecthub’s liveness probes verify that our application is still running and will restart a troubled pod if it notices something is wrong. We can specify an endpoint to hit and how often to check it.
Logging & Monitoring
We have the following Logging and monitoring apparatus in place -
- Logs through Kibana
All logs from applications running in Kubernetes are shipped to our Kibana clusters. Depending on the way logs are produced they are sent to two different locations.

Application logs that are using standard Wayfair logging libraries are shipped to the respective Kibana clusters.
Jira Container STDOUT/STDERR logs are shipped to Kubernetes specific Kibana clusters.

2. Resource monitoring
Grafana is a powerful data visualization UI that allows the user to build rich dashboards using a variety of backend data sources. Projecthub leverages Grafana to monitor general health and resources such as cpu, ram usage, pod bandwidth, etc.

- Performance metrics and Alerts through Datadog
APM (Application Performance Monitoring) provides application tracing so you can see how a request moves through your service, from front end to back end, to the DB/caching layer. At Wayfair, we use DataDog’s APM to instrument Projecthub with full-stack tracing. Projecthub metrics are sent to Prometheus which are then scraped by the DataDog Deployment.
Given below is the snapshot of the Performance dashboard for Projecthub.

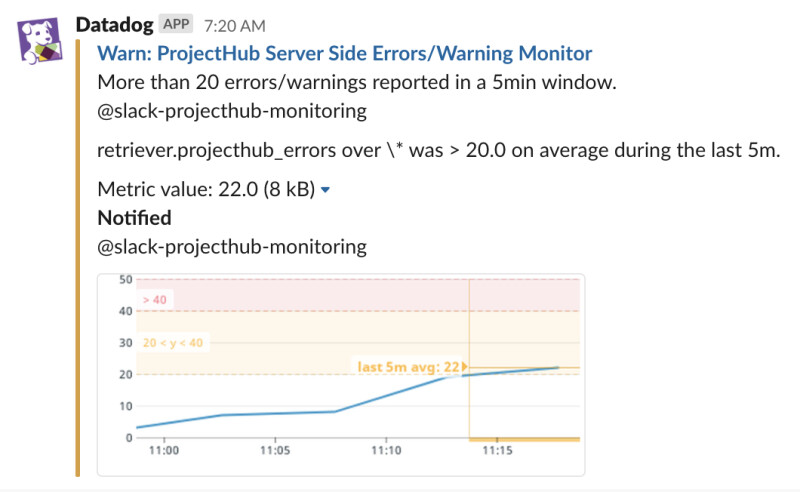
Slack notifications have also been configured to alert us about possible degradations and outages on the system.


