Introduction
At large scale, inventory management isn’t just about knowing what’s in stock — it’s about ensuring that thousands of interconnected systems stay consistent, accurate, and reliable. At Wayfair, our inventory platform had evolved over many years, accumulating shortcuts and direct database integrations that made iteration fast in the short term but increasingly costly in the long run.
By 2022, only a small fraction of inventory writes were going through the official Inventory Service; the vast majority bypassed it and wrote directly to the database. This created duplication of business logic, inconsistent data, operational inefficiencies, and ultimately blocked the evolution of our data model.
What followed was a two-year engineering journey: decoupling every single writer and consolidating all inventory updates through a dedicated service. This article shares how we approached the problem, the phases we went through, the challenges we faced, and the lessons we learned along the way.
Before diving into the solution, I’ll first outline some of the underlying challenges that shaped our approach. Then, I’ll walk through the four main phases of the transition — initial, low-hanging fruit, high value / high effort, and tail — each with its own set of obstacles and learnings.
Engineering Problems
The state of our inventory data and architecture was shaped by years of evolution and bold decisions made in the name of fast iteration, such as allowing teams to write directly to the inventory database. Over time, this led to a situation where only 4% of data writes were handled by the dedicated Inventory services (two services, one in Kotlin and one in Python). The vast majority of writes were performed directly against the inventory database by other services.
This approach created several problems:
- Logic duplication – many teams re-implemented the same rules over and over. In practice, there were 128 separate business flows performing data modifications.
- Inconsistent implementations – not every team got it right. Some implementations contained bugs, and developers often misunderstood the data model, leaving the data in an inconsistent state.
- No concurrency control – since modifications bypassed services and went directly to the database, there were no resource-locking mechanisms. This caused classic issues like lost writes.
- Model evolution blocked –With so many dependencies writing directly to the schema, changing the model became nearly impossible. Any schema change had to remain backward compatible, both technically and from a business perspective.
- Stored procedures dependency – many critical flows relied on stored procedures, which made the system harder to monitor, test, and maintain.
Business Problems
Because of these technical shortcomings, the business experienced significant problems:
- Operational inefficiencies – inventory placed on unnecessary holds or blocked from fulfillment.
- Inaccurate reporting – distorted sales, stock, and demand signals leading to poor decisions.
- Lost revenue opportunities – products physically in the warehouse but unsellable online.
- Constrained expansion – physical retail and other new business functions were difficult to support. Building new flows on top of the legacy inventory solution was slow and costly.
Writer Decoupling
At some point, we made the decision to launch an initiative to decouple writers. The idea was simple: all writes to inventory data should go through a dedicated Inventory Service, rather than directly to the database.
The main business driver was straightforward: reduce operational errors and improve reporting accuracy. By strengthening product data quality, the company aimed to ensure smoother day-to-day operations, better decision-making, and more efficient use of warehouse capacity.
From the technical perspective, the goals were equally important:
- Consolidate business logic in a single place.
- Reduce code duplication across teams.
- Prepare the Inventory Service for a future migration away from the monolithic database to its own dedicated database.
This effort was not just a data migration. It was a consolidation of all writers into one service, establishing the foundation for cleaner, safer, and more maintainable inventory operations.
Success Metrics
One of the key success metrics for the initiative was to increase the percentage of writes handled by the Inventory Service while simultaneously reducing the number of business flows writing directly to the database.
To measure progress, we leveraged the SQL Server CONTEXT_INFO feature together with an Outbox table. This allowed us to track database changes. After exporting the data into GCP BigQuery, we could build detailed statistics and visualizations.
Not every writer corrupted data in the same way. However, by analyzing the main “failure modes,” we found that most direct database writes produced a comparable number of errors.
For clarity and simplicity, we defined the success metric as the adoption rate of the Inventory Service.

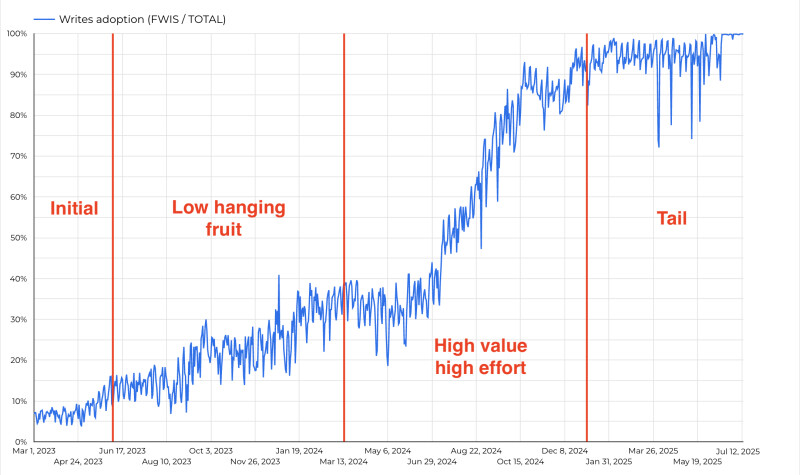
Phases
In the rest of this article, I’ll walk through the progress of the project — specifically how the adoption rate grew across different phases.
- Initial phase (~1 quarter) – adoption increased by about 8% (from initial 4% to 12%).
- Low-hanging fruit (~3 quarters) – adoption increased by about 23% (from 12% to 35%).
- High value / high effort (~3 quarters) – adoption increased by about 60% (from 35% to 95%).
- Tail (~2 quarters) – adoption increased by about 5% (from 95% to 100%).
Of course, the phases were not strictly sequential. In reality, the workstreams overlapped and the process looked much more agile. For the sake of simplicity in this article, however, I’ll present the progress in a waterfall-like breakdown.
Initial Phase
This phase lasted about one quarter and increased the adoption rate by roughly 8% — from initial 4% to 12%.

In this phase, the team assumed ownership of the Inventory Service. The project was maintained only for some years, without any focus on it. The handover was smooth overall, but several critical project details were not fully captured during the knowledge transfer.
The overall inventory traffic handled by the service was only 4%. The rest of the traffic was done outside of the service.
Before starting the integration with other teams, we decided to make some internal technical improvements to the service. This allowed us to address existing limitations early on, ensuring the system was more stable and easier to extend once the new components were introduced:
- We stabilized the service (tuned monitoring and alerting, scaled out the instances, Kafka partitions).
- Gained visibility by exporting data to GCP BigQuery,
- We needed to consolidate the codebase. The main service was written in Kotlin, the sibling service in Python with SQL code exposed as the endpoint. We moved the logic written in SQL as it is for now, keeping the same REST contracts,
We added many features like:
- Security - we used Istio for it
- Locking - we used distributed locking in Redis
- Idempotency check - we used a Stripe-like idempotency mechanism (financial pattern worked great in our case).
- GraphQL - a reading mechanism, flexible enough for many clients.
- Streams - we used Kafka and later GCP PubSub,
Many design decisions have been made:
- use Domain Driven Design in the application
- Solved dilemmas muti-tenant vs single tenant system - we decided to start with muti-tenant system.
- Decide if we use asynchronous or synchronous ways of communication - we decided to use synchronous
Once the service was stabilized, properly monitored, and technically improved, we moved on to the first external integrations. As a proof of concept, we connected a few writers to validate the approach. Adoption at this stage was modest, but it gave us the confidence we needed to move forward.
Low Hanging Fruit

During this phase, over the course of 3 quarters, we increased the adoption rate from roughly 12% to 35%.
The key challenge was to deeply understand the domain and model the inventory state machine. This required not only technical work but also a lot of collaboration. My team spent a significant amount of time talking with other teams, ensuring that our understanding of the domain was accurate and shared.
This was also the phase where we began integrating with many teams and projects. These integrations provided a major boost to adoption and, more importantly, significantly reduced the amount of bad data in the system.
At the start, we focused on a few simple integrations. Our main criterion was achieving an easy increase in adoption with minimal effort — for example, by connecting to existing APIs or building new, lightweight ones. We also considered not only the technical complexity but also how smoothly the teams could collaborate. These early successes built trust and demonstrated our ability to deliver, laying the groundwork for more complex collaborations later on.
High Value / High Effort Phase
This phase took about 3 quarters and increased adoption from 35% to 95%.

Once the easy integrations were behind us, the real challenge began: the high value / high effort phase. Unlike the quick wins, this stage demanded deep architectural work and complex integrations.
For our team, one of the toughest milestones was decoupling the Cycle Count service—the backbone of recurring warehouse inventory checks. From a reporting perspective, the company relies on physical inventory counts reconciled against system records, and this single service accounted for nearly 25% of overall traffic. At the same time, it was a major source of data corruption, struggling to handle distributed transactions. Originally built as part of a monolithic PHP application with an outdated codebase, breaking it out into a standalone microservice was not a trivial task. We approached the transition step by step, carefully designing each stage to ensure delivery without jeopardizing ongoing operations.
At first, progress wasn’t obvious. The early stages of decoupling showed little change in adoption metrics, as captured in our writes adoption diagram. But when the final pieces fell into place, the impact was unmistakable — adoption spiked sharply, proving that the long and difficult effort had been worth it.
The Final Stage: The “Tail” — Low Value / High Effort

The last stage of the project was what we referred to as the tail: around 40 writers that collectively accounted for only about 5% of overall adoption. By this point, the business gains were mostly realized, but we would not get the full value until 100% of the volume was moved over. Nevertheless, the company decided to push forward and complete the effort.
Another category of work during this stage focused on administrative tools. At the time, certain processes — like fixing inconsistent records — were still handled manually. To support the shift to our new architecture, these tools needed to be re-routed so they could talk to the updated endpoints.
In practice, not every client had the capacity to implement the necessary write decoupling on their own. To prevent bottlenecks, we stepped in directly: diving into their business logic, teasing out hidden requirements, and applying the necessary changes within their codebases. This ensured that the migration kept moving smoothly, without leaving anyone stuck on the old path.
During this period, I noticed an interesting pattern: some writers that had already been decoupled began reappearing in the adoption statistics. Each time a new writer showed up, our alerting system notified the team, and we had to investigate the source of the issue with other teams. On the adoption chart, this manifested as temporary drops in overall adoption.
To solve this, we designed a mechanism to block unauthorized writers. Specifically, we implemented a database trigger that rejected transactions coming from disallowed writer names ( CONTEXT-INFO). Naturally, this also required building a dedicated alerting and monitoring system to ensure full visibility into blocked operations.
Final Thoughts
This was the longest, most complex, and most impactful technical project I have ever led. Along the way, I collected many lessons — some obvious, others more strategic — that I intend to carry forward into future projects.
- Understand the domain. Deep knowledge of the domain and the customers is essential. For systems used daily by real-world employees, it is especially critical to meet with them, understand their workflows, and see their challenges firsthand. These insights shaped decisions that no purely technical analysis could have revealed.
- Gaining visibility as quickly as possible was key — decisions backed by real numbers are much easier to make and to communicate across the organization. The visual representation of progress was a big win: it not only made the data easier to digest, but also added a fun, gamified element to the project.
- A brave decision is better than no decision. A fast decision loop was critical. We gathered the right people, made the best possible decision with the data we had, and moved forward. Waiting for perfect information often delayed progress more than it helped. Our guiding principle became: good enough now is better than perfect too late. And of course, decisions could always be revisited if needed.
Measure progress. A real-time GCP BigQuery dashboard became the backbone of our progress tracking. The adoption diagram turned into a form of gamification for the team — managers and developers alike enjoyed seeing the progress during bi-weekly reviews. Every migration was visible, as was every drop (or return) of a writer.