At Wayfair, the data science teams collaborate with other partner teams to translate business problems into analytical frameworks, leverage data and machine learning to make robust predictions and recommendations, and build engineering architecture to scale up machine learning solutions. In a recent machine learning seminar at Northeastern University in Boston, Data Science Manager Jen Wang gave an overview of the team’s structure and a few examples of machine learning models used to solve business challenges at Wayfair. The final part of the seminar illustrates a case study (beginning at 23:40 in the video) of how marketing data scientists at Wayfair use uplift modeling to drive incremental revenue in display remarketing.
Uplift modeling, also known as incrementality modeling or persuasion modeling, models the causal effect of a treatment on the outcome for different individuals. Uplift modeling has been widely applied in marketing, 1 personalized medicine, 2 and political elections, -- scenarios in which you don’t simply want to predict an outcome, but predict how that outcome might change with respect to a treatment.

Figure 1 shows four customer segments based on how the treatment (e.g., advertisements) affects their conversion outcome (e.g., purchases). Marketers can maximize their return on investment (ROI) by targeting people who are most likely to be positively influenced by the marketing advertisements (“persuadables”). Traditional marketing campaigns that target customers with high conversion rates (traditional conversion modeling) may not maximize ROI, since those people might buy without seeing an ad (“sure things”). Uplift modeling, on the other hand, can distinguish “persuadables” from “sure things” to drive incremental revenue (Eq. 1) and maximize ROI.
IR = R (treated with ad) - R (no ad)
[Equation 1. Note: Incremental Revenue (IR) is the revenue (R) generated as a result of marketing advertisements.]
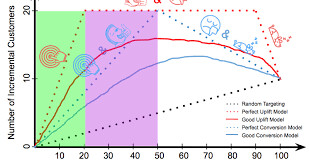
To illustrate how uplift modeling can produce better targeting strategies than the traditional conversion modeling, let’s do a thought experiment. Suppose there are 100 customers with segment compositions as specified in Figure 1. Since 50 customers would convert if they saw ads and 40 would convert if they did not see ads, there are 10 incremental customers in the entire population. Figure 2 plots the cumulative uplift, where the vertical axis is the number of incremental customers in the targeted population, and the horizontal axis is the number of customers targeted. Random targeting would follow the dotted black line, where 1 in every 10 targeted customers would convert as the result of seeing ads. The dotted red and blue lines illustrate targeting strategies based on a perfect uplift model and a perfect conversion model, respectively. To achieve maximum number of incremental customers, a perfect uplift model would target only the 20 “persuadables”, while a perfect conversion model would need to target 50 customers since it cannot distinguish “persuadables” from “sure things”. If the revenue/cost per customer is constant, marketing based on the uplift model (green area) would drive the same incremental revenue as marketing based the conversion model (green area plus purple area) at only 40% of the marketing cost. In either case, targeting the remaining customers would reduce ROI and eventually reach the same endpoint as random targeting. This is how things work in theory. In reality, no customers strictly fall into one of the four segments in Figure 1, and the outcome is a probability ranging from 0 to 1 rather than a boolean outcome (0/1). This produces noise in targeting, as illustrated by the solid blue and red curves for conversion model and uplift model, respectively.

To apply uplift modeling in display remarketing, we designed an experiment where customers were randomly assigned into Test and Control groups to receive either Wayfair ads or PSAs (public service announcements), respectively. From the impression data, we developed an uplift model to predict the user-level incrementality (or “uplift”) based on their behavior and the treatment variable (Eq. 2).
Uplift (x, T) = p (y=1 | X, T=1) - p (y=1 | X, T=0)
[Equation 2. Note: In Eq. 2, y is the outcome variable (e.g., conversion), X represents customer behavior, and T is the treatment variable (1: Test; 0: Control). Uplift is the difference in the outcome probabilities caused by the treatment.]
An additional challenge in display remarketing is its real-time auction mechanism. Display remarketing campaigns involve billions of real-time auctions every day across Internet, and advertisers need to submit their bids within milliseconds as each auction becomes available. We developed a click-through rate model that scores the quality of available ad inventory in real time to adjust the user-level bid predicted by uplift modeling. The user-level and inventory-level predictive models together form Wayfair’s real-time bidding algorithms to send our display re-marketing ads to the right people at the right time in the right place across Internet.
For more details, check out the slides! And if you happen to be in Boston, we are presenting an extended version of this work at the Open Data Science Conference - Friday, May 4, at 11:10am in Room 210A.
Wayfair's Data Science Team and Case Study: Uplift Modeling from Patricia Stichnoth
References:
1. Radcliffe, Nicholas J., and Patrick D. Surry. "Real-world uplift modelling with significance-based uplift trees." White Paper TR-2011-1, Stochastic Solutions (2011).
↩
2. Jaskowski, Maciej, and Szymon Jaroszewicz. "Uplift modeling for clinical trial data." In ICML Workshop on Clinical Data Analysis. 2012.
↩